Just watched an amazing 7-minute TED talk from Sean Gourley on The Mathematics of War where an interdisciplinary team of researchers (physics, mathematics, economist, intelligence, computers) figured out how to mine data from public streams of information to collect and analyze modern warfare.
It turns out that when they began plotting the number killed in an attack with the frequency of those attacks, they found the data was linear. Not only was this relationship linear, but the same linear relationship then appeared in every modern war they looked at (with slopes that varied slightly).

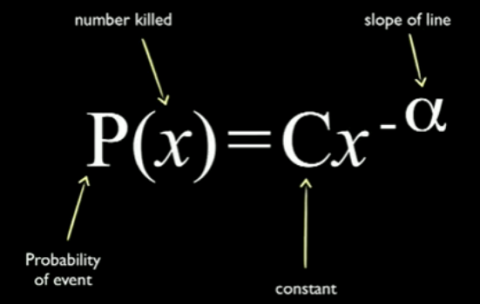
So, next they modeled the probability of an event where x people are killed.

Finally, they went back to each conflict to try to understand the meaning the slope of the line. It turns out that the alpha value (which hovers around 2.5) has to do with the organizational structure of the resistance. If the resistance becomes more fragmented, it is pushed closer to 3. If the resistance becomes more organized, it is pushed closer to 2.
Anyways, it’s only seven minutes, give it a view!


